The impact of R&D
on EBIT1).
1) Earnings before interests and taxes
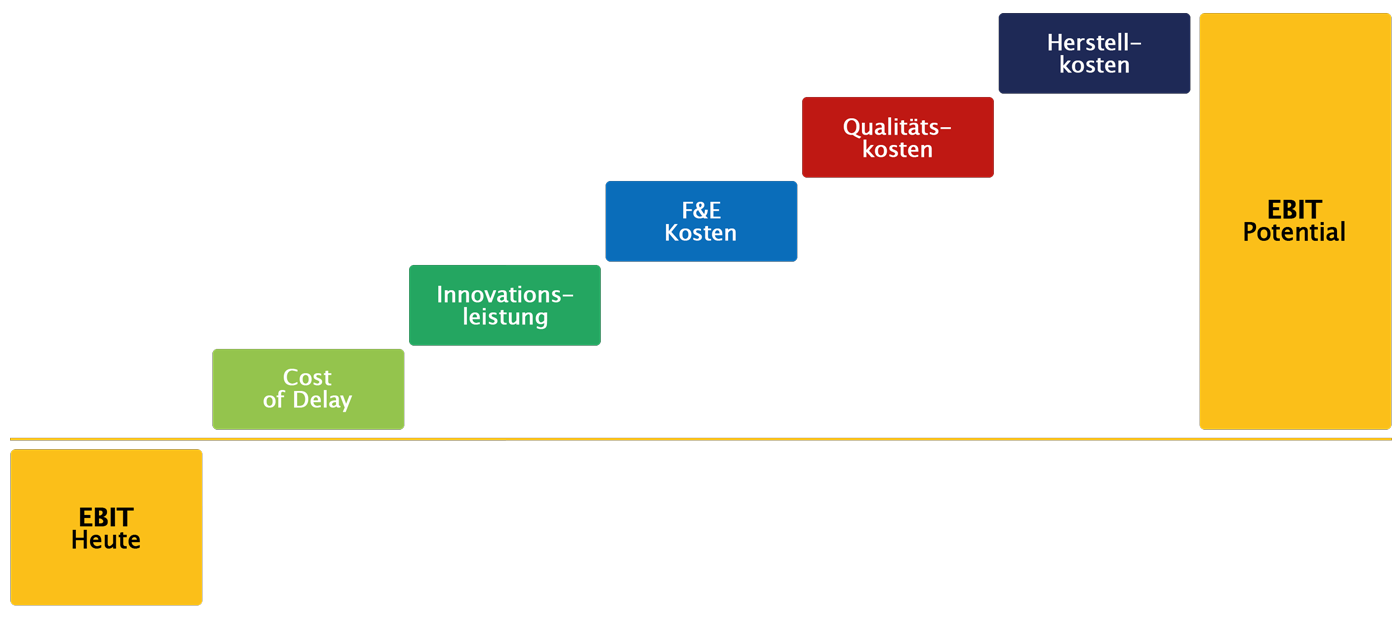
Cost of Delay.
Those who bring their new products to market too late miss the market window and incur “opportunity costs”—through lost revenues and thus profits. Delays result in higher project costs.
Innovation.
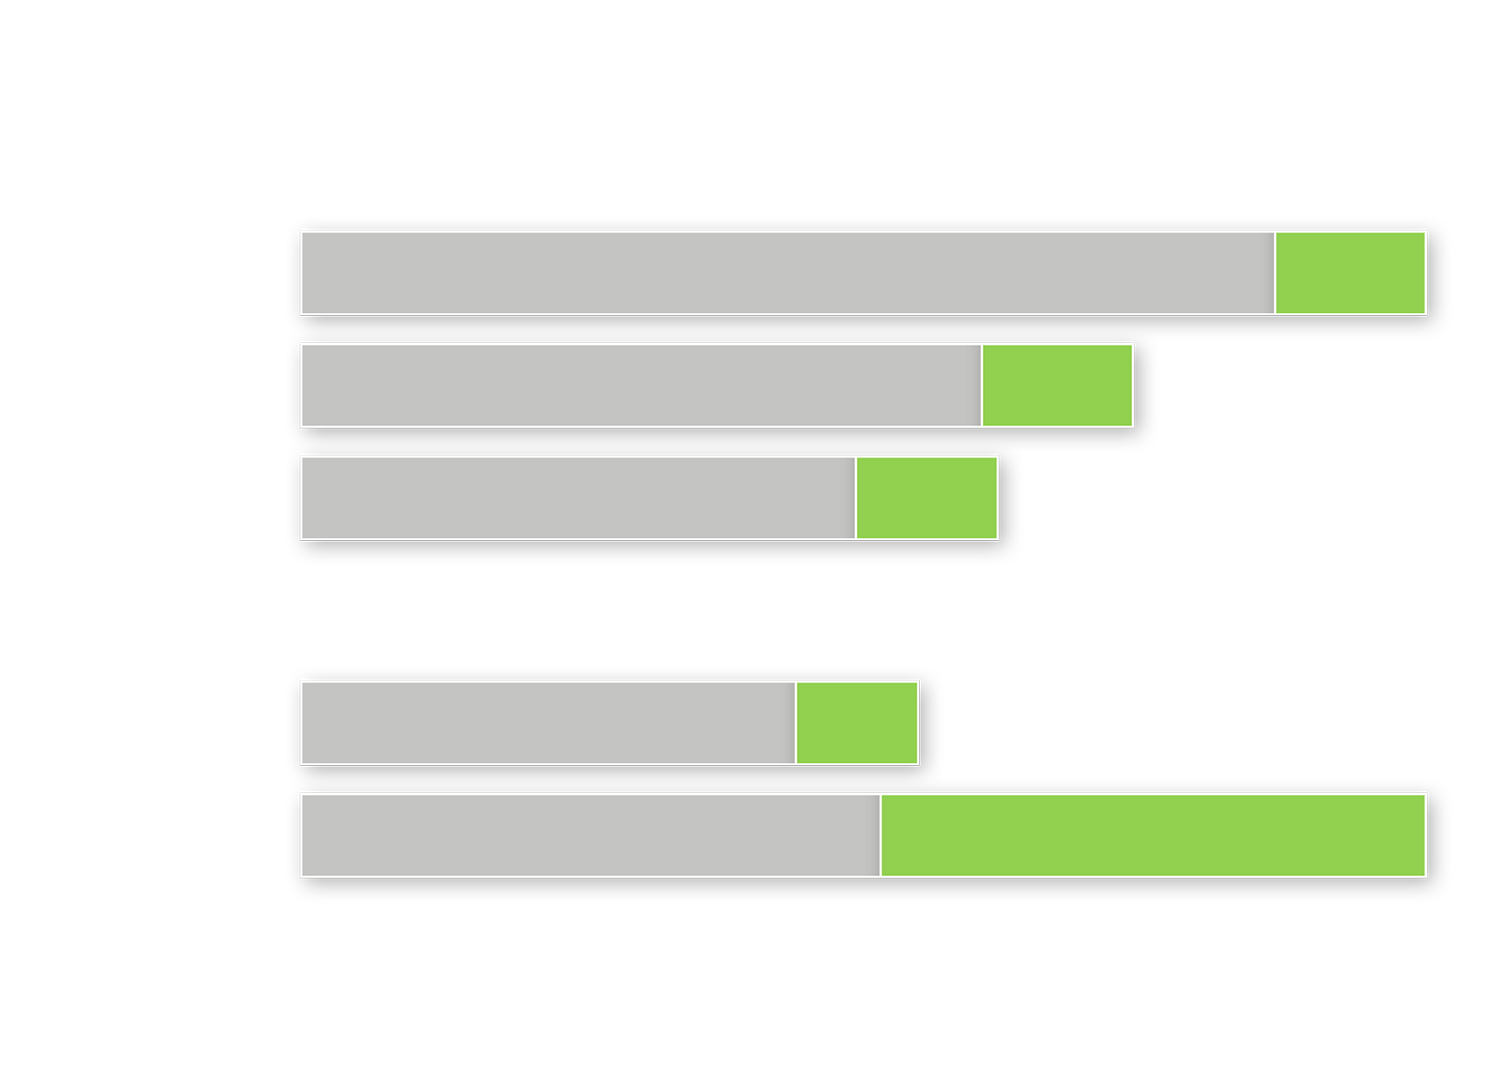
How much EBIT does your R&D generate through innovations? What is the proportion of genuine innovations compared to product maintenance? How healthy is the balance between product substitutions (successor versions) and product portfolio expansions (new to the range)? What does the benchmark achieve in the industry or industry segment? Do you have an innovation deficit?

R&D Costs.
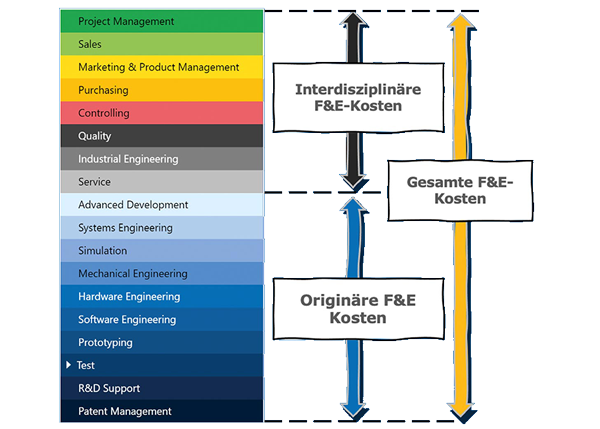
Every company calculates R&D costs differently. Comparing annual report figures is superficial and often simply incorrect. We categorize R&D costs into 18 cost types—divided into original and interdisciplinary R&D costs. This is the basis for R&D benchmarking comparisons. It’s essential to compare apples with apples.
Now you can see if the investments in R&D are too high or too low compared to the benchmark. Too much indicates efficiency potential—too little can endanger the future. But these are only initial indicators.
In-depth analyses come in the Deep-Dive: Even if the total R&D costs are inconspicuous, an unfavorable distribution can lead to insufficient output. Too much product maintenance and too little pre-development? Many detail experts—too few system engineers? Can R&D sufficiently focus on the development and management of the product portfolio, or do they have to take on too many tasks from other departments?
A comprehensive R&D cost analysis reveals quantitative gaps and sets clear objectives. This ensures your R&D is in best shape.
Quality costs.
“Unripe bananas” cause start-up costs, rework, warranty, guarantee, and potentially recall costs—these are known as non-conformity costs (NC). NC costs can also be caused by production and suppliers. The proportion caused by “design errors” is relevant here.
What is your R&D–EBIT potential through NC?


Manufacturing costs.
An intelligent product architecture is modular and standardized, consists of as few individual parts as possible, allows for automated manufacturing steps, and enables quick assembly. Optimizing the product architecture boosts the EBIT. An indicator of this EBIT potential is the deviation from the manufacturing cost targets.
With high production volumes, this R&D EBIT contribution is the greatest.
We evaluate your R&DPerformance.
The R&D Performance Self-Assessment.
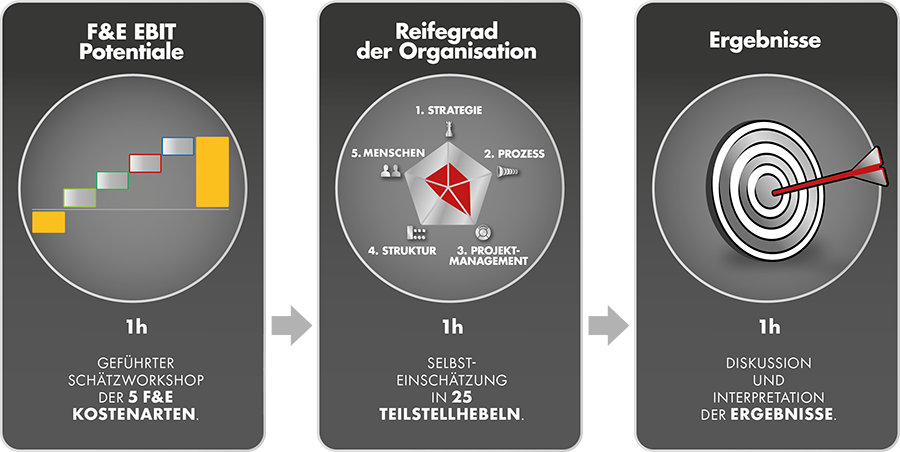
In a 3-hour workshop with the R&D leadership team, you will get to know our methodology:
Part 1: Self-assessment of R&D EBIT cost potentials.
Part 2: Organizational maturity in 5 levers.
Part 3: Result interpretation.
Through scenario-based delineation, it quickly becomes clear whether an implementation is worthwhile.
